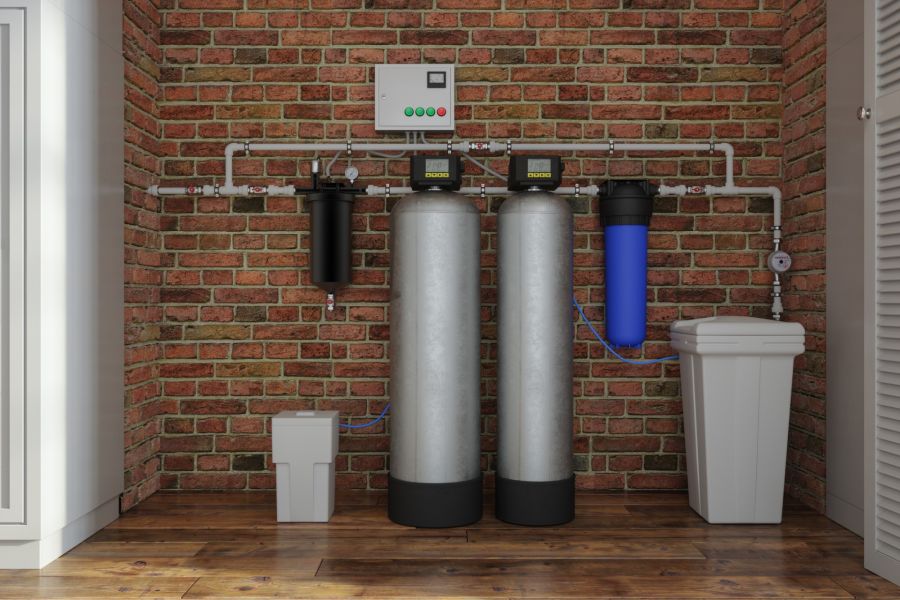
Corona, California draws its drinking water from two primary sources: blended supply delivered by the Metropolitan Water District of Southern California (MWD) through the Colorado River Aqueduct and State Water Project, and local groundwater from the Riverside Basin. MWD blended deliveries to Southern California utilities typically measure 130 to 170 milligrams per liter in total hardness depending on seasonal blend ratios, according to MWD's published water quality reports at mwdh2o.com. After mixing with Riverside Basin groundwater, tap hardness in Corona commonly reaches 200 to 300 mg/L (12 to 18 grains per gallon), which the Water Quality Association classifies as very hard. City of Corona Utilities publishes an annual Consumer Confidence Report at coronaca.gov covering all contaminant results. Contaminants detected below legal limits include trihalomethanes, chromium-6, and haloacetic acids, consistent with other Southern California cities served by chlorinated surface water. These water quality characteristics translate directly to scale on fixtures, reduced appliance efficiency, and drinking water that many families treat at the tap.
Schedule a free water test in Corona to see exactly what is in your tap water. Call us at (949) 873-1129.
Where does Corona's drinking water come from?
The City of Corona is the primary public water utility serving most residential and commercial connections in Corona. The city's water supply comes from two sources that are blended in ratios that shift throughout the year.
The first and larger source is wholesale supply from the Metropolitan Water District of Southern California. MWD is a regional wholesaler that serves 26 member agencies covering parts of Los Angeles, San Diego, Orange, Riverside, San Bernardino, and Ventura counties. For Corona, MWD delivers water through its distribution system to the western Riverside County area.
MWD draws from two primary sources. The Colorado River Aqueduct carries water from Lake Havasu in Arizona across the Mojave Desert to treatment plants in the Inland Empire area. The California State Water Project delivers water from the Sacramento-San Joaquin Delta through the Delta Mendota Canal and California Aqueduct to MWD's Diamond Valley Lake in Hemet. MWD blends these two sources at its treatment plants before delivering to local utilities.
Colorado River water is naturally high in dissolved minerals that accumulate across its course through sedimentary rock formations. State Water Project water originates in the Sierra Nevada and North Coast mountains, passing through granite-dominated geology that contributes fewer minerals, making it considerably softer. The final MWD blend varies seasonally based on conditions in each source watershed.
The second source is local groundwater pumped from the Riverside Basin, a regional aquifer system underlying western Riverside County. Groundwater from this basin has been in contact with local geology for extended periods and typically carries a higher mineral load than MWD imports.
How this water quality data was compiled
All data in this article comes from primary public sources: Metropolitan Water District's annual water quality reports, City of Corona Utilities Consumer Confidence Reports, and data published by the State Water Resources Control Board.
Under the federal Safe Drinking Water Act, public water systems serving 25 or more people must publish a Consumer Confidence Report (CCR) annually by July 1, covering water quality results for the prior calendar year. California requires utilities to file these with the State Water Resources Control Board. Readers can access reports through the SWRCB's Electronic Annual Reporting database at waterboards.ca.gov or directly at the city utility's website. The EPA operates a national CCR lookup at epa.gov/ccr.
Metropolitan Water District publishes its own water quality data at mwdh2o.com, which provides context for the blended wholesale supply that enters local distribution systems before mixing with local groundwater.
Because blend ratios shift seasonally and year to year, and because tap water hardness can vary within a utility's service territory based on proximity to different source zones, readers should verify specific numbers against their utility's most recent CCR rather than treating utility averages as precise individual tap readings.
What does Metropolitan Water District's water quality data show?
Understanding MWD's water quality is essential for interpreting what comes out of Corona taps, since MWD-delivered water forms the majority of the supply in most years.
MWD publishes an annual Water Quality Report and more detailed data through its water quality monitoring program. Key indicators relevant to Corona homeowners include:
Total hardness: MWD's blended deliveries to member agencies in typical years measure 130 to 170 milligrams per liter (mg/L) as calcium carbonate, equivalent to approximately 8 to 10 grains per gallon, based on MWD's published water quality summaries. This variation reflects shifts in the Colorado River to State Water Project blend: heavier Colorado River reliance pushes hardness toward the higher end of the range, while greater SWP use produces softer output.
Total dissolved solids (TDS): TDS in MWD blended deliveries typically runs 350 to 550 mg/L, according to MWD's monitoring data. The EPA secondary standard for TDS is 500 mg/L, a non-enforceable benchmark above which taste effects become more noticeable for many people.
Disinfection byproducts: MWD treats all delivered surface water with chlorine or chloramine to meet federal disinfection requirements. Trihalomethanes (TTHMs) and haloacetic acids (HAAs) form as chlorine reacts with naturally occurring organic matter in source water. MWD's delivered water meets the EPA's TTHM MCL of 80 micrograms per liter and the HAA5 MCL of 60 micrograms per liter. These byproducts are common in all chlorinated water systems, including those across the Inland Empire.
For comparison with the broader Southern California region, see our data summary for Riverside County water quality by utility, which covers the full range of water characteristics across western Riverside County systems.
What happens when MWD water blends with local groundwater in Corona?
Local groundwater from the Riverside Basin typically carries higher mineral content than the MWD blended supply. Groundwater in this basin has been in contact with alluvial and sedimentary formations over extended periods, picking up calcium, magnesium, sodium, and other dissolved minerals in the process.
When City of Corona Utilities combines this groundwater with MWD imports, the resulting tap water hardness is generally higher than either source alone. The exact blend ratio determines the final result, and that ratio changes based on seasonal availability, drought conditions, and regulatory requirements governing groundwater use.
The practical outcome for homeowners is that hardness at the tap commonly reaches the range of 200 to 300 mg/L (approximately 12 to 18 grains per gallon). At this level, scale accumulation inside water heaters, dishwashers, and pipes is observable. Water heaters in Corona running on very hard water can lose significant efficiency within a few years without treatment. Shower heads and faucet aerators scale up noticeably within months. See our guide to signs you need a water softener for household indicators that hardness is causing measurable damage.
For a broader view of how this blending dynamic plays out across the Inland Empire, see our analysis of water hardness by city across the Inland Empire, which synthesizes CCR data from seven IE utilities.
What contaminants does Corona water contain?
City of Corona Utilities monitors for all regulated contaminants under the Safe Drinking Water Act and California's additional requirements administered by the Division of Drinking Water. All results are included in the annual Consumer Confidence Report. The following are the categories of contaminants most relevant to Corona homeowners based on the characteristics of Southern California water supplies.
Trihalomethanes and haloacetic acids: These disinfection byproducts are present in virtually all chlorinated public water systems. TTHMs form when chlorine reacts with organic matter naturally present in source water. The EPA MCL for TTHMs is 80 micrograms per liter. California cities that draw primarily from surface water sources, including MWD supplies, typically detect TTHMs in distribution systems. Check the current CCR for measured concentrations at distribution points across Corona's service territory.
Hexavalent chromium (chromium-6): California has established a public health goal of 0.02 micrograms per liter for chromium-6, considerably more protective than the EPA's combined chromium MCL of 100 micrograms per liter. Chromium-6 has been detected in Southern California water systems at concentrations below federal MCLs but sometimes above California's health goal. Both surface water supplies and groundwater sources can contain chromium-6. The California Division of Drinking Water requires utilities to report chromium-6 monitoring results in CCRs.
PFAS compounds: California began requiring monitoring for per- and polyfluoroalkyl substances (PFAS) in public water systems under the state's PFAS MCLs, which took effect in 2023. California set MCLs of 5 parts per trillion for PFOA and PFOS individually, and 10 ppt for each of four other PFAS compounds. EPA also finalized federal PFAS MCLs in 2024 at the same level for PFOA and PFOS. Groundwater sources in Riverside County have shown PFAS detections in state monitoring data. Utilities must notify customers if PFAS levels exceed applicable MCLs. Review current CCR data for Corona's specific monitoring results.
Arsenic: Arsenic occurs naturally in groundwater throughout Southern California due to regional geology. California's MCL for arsenic is 10 micrograms per liter, matching the federal standard. Local groundwater components in blended supplies can introduce arsenic at trace levels. CCR data specifies measured concentrations for each monitoring period.
For a comparison of how PFAS data looks across the wider region, see our coverage of Inland Empire PFAS water data for 2026, which synthesizes state monitoring results across San Bernardino and Riverside counties. For guidance on the most common signs that water quality is affecting your home, see signs you need water softeners and signs of hard water in your home.
How does Corona water compare to neighboring Inland Empire cities?
Corona sits in the western corner of Riverside County, bordered by the cities of Norco and Jurupa Valley to the north, Riverside to the east, and San Juan Capistrano and Mission Viejo in Orange County to the southwest via the 91 freeway corridor. Water quality across the immediate region varies based on each utility's source blend.
Rancho Cucamonga: Served by Cucamonga Valley Water District (CVWD), which draws from a mix of MWD supply and local Chino Basin groundwater. The Chino Basin carries higher mineral loads from its geology and land use history, producing tap water hardness commonly reported at 280 to 340 mg/L (16 to 20 gpg) in recent CCRs. Rancho Cucamonga water has also been a focus of PFAS monitoring given documented contamination in portions of the Chino Basin. See our guide to Rancho Cucamonga water quality and chromium for details.
Riverside (City of Riverside, served by Riverside Public Utilities): Riverside Public Utilities draws from Lake Matthews, the San Jacinto River, and groundwater, producing hardness in the range of 170 to 255 mg/L (10 to 15 gpg) depending on season and source blend, according to Riverside's CCR data cited in our Riverside County report. Riverside typically has somewhat softer water than Corona on average, reflecting a higher proportion of surface water in its supply.
Jurupa Valley (Jurupa Community Services District): TDS approximately 350 ppm per 2024 CCR data, with detected contaminants including arsenic, uranium, chromium-6, and nitrates, reflecting its heavier groundwater reliance.
Lake Elsinore (Elsinore Valley MWD): EVMWD records some of the highest TDS in Riverside County, approximately 1,010 ppm in reported data, driven by heavy reliance on local basin groundwater with high mineral content.
This comparison illustrates a pattern across the Inland Empire: cities closer to primary MWD supply and with lower groundwater proportions tend to have lower hardness and TDS, while those drawing more heavily from local basins see higher mineral loads.
What water treatment is right for a Corona home?
The most effective treatment depends on which specific contaminants are present at your particular tap, not on utility averages. A free water test establishes the baseline. That said, the water quality characteristics typical of Corona suggest the following treatment options are worth evaluating.
Water softener for hardness: A salt based water softener using ion exchange is the most effective treatment for hardness in the 12 to 18 grains per gallon range typical of Corona tap water. The softener removes calcium and magnesium ions before water reaches any fixture, eliminating scale accumulation in water heaters, dishwashers, washing machines, pipes, and showerheads. Softened water also reduces soap and detergent usage. Water softeners in Corona covers the options for local homeowners.
Reverse osmosis for drinking water: A reverse osmosis (RO) system certified to NSF/ANSI Standard 58 reduces TDS, chromium-6, PFAS compounds, arsenic, nitrates, and most dissolved contaminants by 90 to 99 percent at the drinking tap. RO systems work at the point of use, treating only the water you drink and cook with rather than the whole house supply. This makes them highly cost effective for improving drinking water quality. Reverse osmosis systems in Corona explains the available configurations.
Combo systems for comprehensive treatment: Many Corona homeowners combine a whole house water softener with a point of use reverse osmosis system. The softener handles hardness throughout the home while the RO addresses dissolved contaminants at the kitchen tap. Combo water treatment systems in Corona covers this paired approach.
Whole house filtration for broad contaminant reduction: A whole house carbon filtration system reduces chlorine, chloramine, TTHMs, and some organic compounds at every fixture in the home. This complements a water softener rather than replacing it, since carbon filtration does not remove hardness minerals. Whole house water filtration in Corona covers the filter types suited to Southern California supply characteristics. See also signs you need whole house water filtration to assess whether this fits your situation. For point of use drinking water concerns, signs you need a reverse osmosis system outlines when RO makes the most sense.
For context on how filtration choices work across the wider Inland Empire region, see our Inland Empire water filtration guide covering the treatment options most effective for regional water quality patterns.
How to get Corona's current water quality data
The most reliable source for specific, current water quality data in your service zone is City of Corona Utilities. Their Consumer Confidence Report is published annually by July 1 at coronaca.gov.
For the imported supply component, Metropolitan Water District publishes detailed water quality monitoring at mwdh2o.com, including results from their treatment plants and distribution system.
The State Water Resources Control Board's Electronic Annual Reporting system is the statewide repository for all California public water system CCRs, searchable by utility name at waterboards.ca.gov.
For PFAS monitoring results specifically, California maintains a public data viewer through the Division of Drinking Water that shows PFAS detections by water system across the state.
If you would like precise data for your specific address and service zone rather than a utility-wide average, a free water test in Corona provides a detailed analysis of what is actually at your tap. You can also learn what to expect from free water testing before scheduling. Call (949) 873-1129 to schedule.
Frequently asked questions about Corona, CA water quality
How hard is tap water in Corona, CA?
Corona tap water is served primarily by City of Corona Utilities, which blends Metropolitan Water District (MWD) supply with local Riverside Basin groundwater. MWD blended deliveries to Southern California utilities typically show hardness in the range of 130 to 170 mg/L (8 to 10 gpg) depending on the Colorado River to State Water Project blend ratio. After mixing with local groundwater, end hardness at Corona taps commonly reaches 200 to 300 mg/L (12 to 18 gpg), which the Water Quality Association classifies as very hard. Your utility's current Consumer Confidence Report at coronaca.gov gives the most accurate figure for your service area.
Is Corona tap water safe to drink?
City of Corona Utilities meets all state and federal drinking water standards. The Safe Drinking Water Act requires public water systems to keep all regulated contaminants below Maximum Contaminant Levels set by the EPA, and California imposes additional requirements through the Division of Drinking Water. Meeting these standards means the water is legally safe. California also publishes voluntary public health goals for some contaminants, including chromium-6, that are more protective than federal limits. A free water test identifies what is actually present at your tap.
Does Corona water have PFAS?
California began statewide PFAS monitoring in public water systems starting in 2020 under EPA's UCMR5 program and California's own monitoring requirements. Some Corona area groundwater sources have shown PFAS detection in state monitoring data. City of Corona Utilities publishes PFAS monitoring results in its annual Consumer Confidence Report and is required to notify customers if PFAS levels exceed California's MCL of 5 parts per trillion for PFOA and PFOS individually. Check coronaca.gov or the State Water Board's PFAS data viewer for current results.
Why does Corona water taste different in summer?
Metropolitan Water District adjusts its blend of Colorado River water and State Water Project water seasonally based on snowpack, reservoir levels, and drought status. Colorado River water is harder and higher in TDS than SWP water. During late summer when snowmelt is reduced and reservoirs draw down, utilities often receive a higher proportion of Colorado River supply, which can raise mineral content and affect taste. Local groundwater use also shifts seasonally, which influences the final mineral profile at the tap.
Where can I find Corona's official water quality report?
City of Corona Utilities publishes its annual Consumer Confidence Report at coronaca.gov/utilities. California also requires all utilities to file CCRs with the State Water Resources Control Board, searchable at waterboards.ca.gov. The EPA national CCR lookup is at epa.gov/ccr. Metropolitan Water District publishes its own water quality data covering all wholesale deliveries at mwdh2o.com, which is useful for understanding the imported supply that enters the local distribution system before blending.
What water filter is best for hard water in Corona?
For hardness in the 12 to 18 grains per gallon range typical of Corona, a salt based water softener using ion exchange is the most effective treatment option. It removes calcium and magnesium before water reaches any fixture, preventing scale in appliances, pipes, and water heaters. For drinking water quality, a reverse osmosis system certified to NSF/ANSI Standard 58 reduces TDS, chromium-6, PFAS, and most dissolved contaminants at the drinking tap. Many Corona households use a whole house softener paired with a point of use RO system.