Tap water across the Inland Empire is hard, but hardness varies meaningfully between cities. Consumer Confidence Reports (CCRs) published by seven major Inland Empire utilities between 2021 and 2024 show total hardness ranging from approximately 170 mg/L in the softest Riverside zones to over 340 mg/L in parts of Rancho Cucamonga, a span of roughly 10 to 20 grains per gallon. The source of that variation is how each utility blends Colorado River water, delivered via the Metropolitan Water District, with local groundwater from the San Bernardino, Riverside, and Chino groundwater basins. Cities that draw more heavily from local wells, which pick up calcium and magnesium as they move through the region's geology, tend to show higher hardness. Every city in this report records water the Water Quality Association classifies as hard or very hard. For homeowners across the region, the data translates into a consistent story: scale accumulates, appliances wear faster, and treatment pays off.
Schedule a free water test in the Inland Empire to see exactly where your tap falls. Call us at (949) 873-1129 any time.
Where Inland Empire water comes from
Most Inland Empire utilities draw from two primary sources and blend them in varying ratios.
The first source is Colorado River water delivered by the Metropolitan Water District of Southern California (MWD) through the Colorado River Aqueduct. This water enters the region already carrying dissolved calcium, magnesium, and other minerals accumulated across its desert course. MWD's blended delivery water typically shows hardness around 130 to 170 mg/L before local utilities add their own groundwater.
The second source is local groundwater pumped from three major basins: the San Bernardino Basin, the Chino Basin, and the Riverside Basin. Groundwater in these basins tends to be harder than MWD imports because it has been in contact with local geology for far longer. The San Bernardino Basin groundwater in particular reflects the region's igneous and sedimentary rock formations, which contribute calcium carbonate and magnesium to the water.
When utilities blend these two sources, the result depends on the blend ratio. A utility drawing 70 percent MWD water and 30 percent local groundwater will produce softer water than one drawing 30 percent MWD and 70 percent groundwater. Drought years push utilities toward higher groundwater use, which can raise hardness noticeably at the tap.
How we compiled this data
Each number in the table below comes from the relevant utility's Consumer Confidence Report (CCR). The EPA requires all public water systems serving 25 or more people to publish a CCR annually by July 1, reporting on the prior calendar year. California requires utilities to file these reports with the State Water Resources Control Board.
We reviewed CCRs from 2021 through 2024 for each utility listed and noted the total hardness range as reported. Where utilities expressed hardness in mg/L as calcium carbonate (the standard unit), we converted to grains per gallon (gpg) using the standard conversion factor of 17.1 mg/L per gpg.
Hardness at a specific tap varies from the utility average based on local distribution conditions, proximity to reservoir versus well sources, and season. For your precise reading, a field water test is more reliable than the utility average. That said, utility averages from CCRs are the most authoritative public benchmark available.
Source for all CCR data: California State Water Resources Control Board Electronic Annual Reporting database (waterboards.ca.gov) and individual utility websites. EPA CCR lookup tool: epa.gov/ccr.
Water hardness by city: the data
The table below summarizes typical total hardness reported in CCRs across seven Inland Empire cities. All values represent typical ranges drawn from multiple reporting years (2021 to 2024). Verify against your utility's current CCR for the most recent measurement period.
| City | Utility | Hardness (mg/L) | Hardness (gpg) | Hardness Class |
|---|
| Rancho Cucamonga | Cucamonga Valley Water District | 280 to 340 | 16 to 20 | Very hard |
| Fontana | California Water Service (Fontana District) | 255 to 325 | 15 to 19 | Very hard |
| Ontario | City of Ontario Municipal Utilities | 245 to 315 | 14 to 18 | Very hard |
| San Bernardino | San Bernardino Municipal Water Dept. | 225 to 305 | 13 to 18 | Hard to very hard |
| Rialto | Rialto Utility Authority | 240 to 290 | 14 to 17 | Very hard |
| Corona | City of Corona Water Utilities | 225 to 290 | 13 to 17 | Hard to very hard |
| Riverside | Riverside Public Utilities | 170 to 255 | 10 to 15 | Hard |
Hardness classification follows Water Quality Association standards: soft 0 to 3.5 gpg, slightly hard 3.5 to 7.0, moderately hard 7.0 to 10.5, hard 10.5 to 14.0, very hard above 14.0.
Every city in the table falls in the hard or very hard category. Riverside records the lowest hardness, largely because Riverside Public Utilities draws a higher proportion of surface water from Lake Matthews and the Metropolitan Water District's Inland Feeder system. Rancho Cucamonga and Fontana record the highest readings, consistent with their heavier reliance on local groundwater from the Chino and San Bernardino basins.
What these hardness levels mean at home
Hard water at 15 to 20 gpg behaves differently than water at 10 gpg, though both technically qualify as hard.
Scale accumulation is the most visible effect. Calcium and magnesium carbonate precipitate out of solution when water heats up or evaporates, coating the inside of water heaters, dishwasher spray arms, faucet aerators, and showerheads. At 15 gpg, scale buildup inside a tank water heater is measurable within the first year of use. The Water Quality Research Foundation commissioned Battelle Memorial Institute to study scale's effect on water heater efficiency; that research found that hard water scale reduces gas water heater efficiency and accelerates the need for flushing and maintenance.
Soap lathering is worse at higher hardness levels. Calcium and magnesium react with soap and detergent, forming insoluble soap scum rather than allowing the detergent to clean. Homes at 18 to 20 gpg often use 40 to 60 percent more laundry detergent and dishwasher pods than they would with softened water, according to consumer testing data published by the American Cleaning Institute (cleaninginstitute.org).
Skin and hair absorb the effect too. Hard water leaves a mineral film that strips moisture and interferes with the action of conditioners and moisturizers. The difference is most noticeable in cities at the high end of the table, where hardness exceeds 18 gpg.
Variation within cities matters
The table represents typical ranges at the utility level, not at every tap. Within any given service area, hardness can vary based on which distribution zone and which supply sources feed that neighborhood.
CVWD, for example, operates multiple pressure zones across Rancho Cucamonga and parts of Upland and Fontana. Zones closer to active well fields tend to show higher hardness; zones primarily served by MWD surface water imports run lower. Two homes on the same street served by different distribution mains can show a 2 to 4 gpg difference.
This is the reason a point-of-use water test matters even when you know your utility's average. Schedule a free water test in Rancho Cucamonga, Riverside, Fontana, San Bernardino, or Ontario for a reading specific to your address rather than a utility average.
What reduces hard water in the Inland Empire
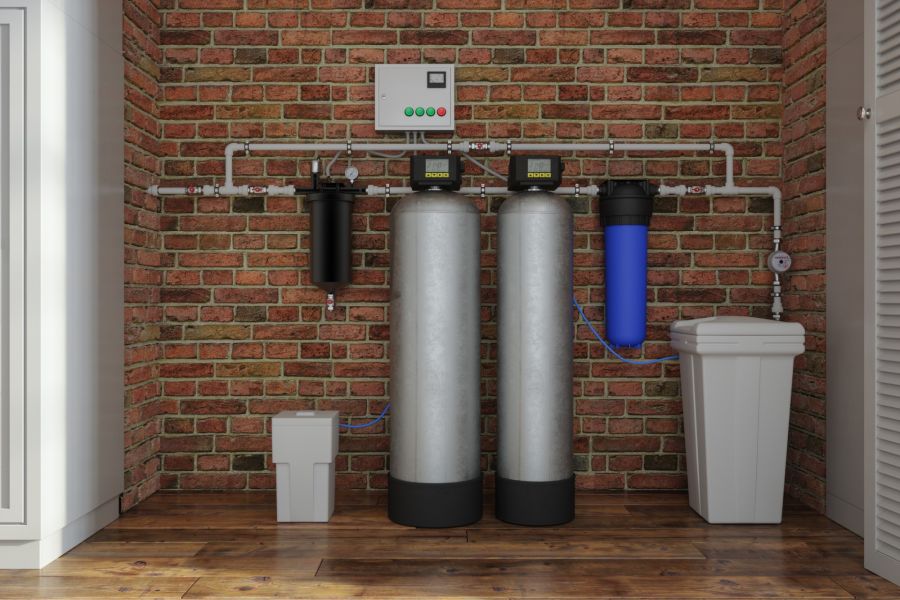
Ion exchange water softeners are the only treatment method that physically removes calcium and magnesium from the water supply. The resin inside the softener swaps sodium or potassium ions for hardness minerals as water passes through, producing soft water at every faucet in the home. Softened water at 0 to 3 gpg stops scale formation and restores soap lathering efficiency.
Salt-free template-assisted crystallization (TAC) conditioners do not remove hardness but convert the minerals into a crystalline form that does not bond to pipe walls, fixtures, or appliances. TAC systems work best at hardness levels below 20 gpg, which covers most of the IE cities in this table.
For drinking and cooking water specifically, a reverse osmosis system at the kitchen tap reduces total dissolved solids, including hardness minerals, to under 50 mg/L regardless of the source water hardness. This addresses taste without treating the whole house.
See whole house water filtration in the Inland Empire and water softeners in Rancho Cucamonga for full treatment options.
Call (949) 873-1129 or book a free water test to see what your tap shows today.