San Bernardino County delivers drinking water from a mix of local groundwater basins and imported Metropolitan Water District supplies, producing water quality that varies sharply by city and utility. Consumer Confidence Reports from major county utilities for 2021 through 2024 show hardness ranging from roughly 9 grains per gallon in the high-desert Victorville area to 16 to 20 grains per gallon in Rancho Cucamonga, the highest in the county among cities covered here. Iron detections in county groundwater wells are documented by the U.S. Geological Survey Groundwater Ambient Monitoring and Assessment program, which found iron above the EPA secondary limit of 0.3 milligrams per liter in a portion of Inland Empire monitoring wells. The EPA Fifth Unregulated Contaminant Monitoring Rule (UCMR5) monitoring program found detectable PFAS in the San Bernardino city water system, all below current federal Maximum Contaminant Levels. This report synthesizes that public record for homeowners across Rancho Cucamonga, Fontana, Ontario, San Bernardino, and Victorville.
Schedule a free water test in San Bernardino County or call (949) 873-1129 to get a direct reading at your address.
What is the water quality in San Bernardino County?
San Bernardino County sits over the San Bernardino Valley groundwater basin and the Chino Basin, two major alluvial aquifers that supply a significant share of local tap water. These basins sit adjacent to each other and are connected to Colorado River imports delivered through the Metropolitan Water District of Southern California. The geology delivers mineral-heavy water: calcium and magnesium dissolve readily from the carbonate formations the water moves through, which is why San Bernardino County as a whole ranks among the harder-water counties in California.
All data below comes from Consumer Confidence Reports (CCRs) published by individual utilities, the WaterHardness.org 2024 dataset aggregated from state-verified lab testing, and the California State Water Resources Control Board Electronic Annual Reporting database. CCRs are public records that every California utility must file by July 1 each year.
San Bernardino County Water Quality by City (2021 to 2024 CCR Data)
| City | Utility | Hardness (mg/L) | Hardness (gpg) | TDS (ppm) | Classification |
|---|
| Rancho Cucamonga | Cucamonga Valley Water District | 280 to 340 | 16 to 20 | ~410 | Very Hard |
| Fontana | California Water Service, Fontana District | 255 to 325 | 15 to 19 | N/A reported | Very Hard |
| Ontario | Ontario Municipal Utilities | 245 to 315 | 14 to 18 | ~410 | Very Hard |
| San Bernardino | San Bernardino Municipal Water Dept | 225 to 305 | 13 to 18 | ~260 | Hard to Very Hard |
| Victorville | Victorville Water District | ~150 | ~9 | ~153 | Hard |
Sources: Cucamonga Valley Water District CCRs 2021 to 2024 (cvwdwater.com); WaterHardness.org 2024 county data (waterhardness.org); California SWRCB Electronic Annual Reporting database (waterboards.ca.gov).
For hardness data specific to Upland, Redlands, and other county cities, access your utility's CCR directly through the SWRCB database linked above. Every utility's report lists hardness in mg/L, which you can convert to grains per gallon by dividing by 17.12.
Which San Bernardino County cities have the hardest water?
Rancho Cucamonga leads the county at 16 to 20 grains per gallon, placing it in the very hard category by any classification standard. The Water Quality Association defines very hard water as anything above 10.5 gpg. At 16 to 20 gpg, a household of four in Rancho Cucamonga runs approximately 8 to 10 pounds of dissolved hardness minerals through pipes and appliances every week.
Fontana and Ontario are close behind. California Water Service's Fontana District and Ontario Municipal Utilities both draw from the Chino Basin and Colorado River imports, which carry elevated mineral loads before treatment. The practical consequences, scale on water heaters, restricted showerhead flow, reduced soap performance, are similar across these three cities.
San Bernardino city water tests somewhat lower, at 13 to 18 gpg, reflecting a blend of San Bernardino Valley Basin groundwater and imported supply that varies seasonally. Victorville Water District, in the high desert, delivers meaningfully softer water at approximately 9 gpg, which the Water Quality Association classifies as hard but not very hard.
For a broader look at how county hardness compares to the rest of the Inland Empire, see our analysis of Inland Empire water hardness by city.
Does San Bernardino County water contain PFAS?
Per- and polyfluoroalkyl substances (PFAS) have been detected in San Bernardino County's drinking water supply. The EPA's Fifth Unregulated Contaminant Monitoring Rule (UCMR5), which collected monitoring data from 2023 through 2025, found PFAS compounds in the San Bernardino Municipal Water Department system. Detected compounds included PFBS at 3.9 to 4.4 parts per trillion, PFHxA at 3.4 to 4.0 ppt, PFHxS at 3.6 to 4.0 ppt, and PFPeA at 3.0 to 3.4 ppt. All four detections fell below current federal Maximum Contaminant Levels. UCMR5 results are publicly searchable at the EPA UCMR occurrence data page.
San Bernardino County has a documented PFAS contamination history tied to historical military and industrial use. Norton Air Force Base, which operated in San Bernardino from 1942 through 1994 (now San Bernardino International Airport), used aqueous film-forming foam (AFFF) that contained high PFAS concentrations. The California State Water Resources Control Board's 2022 General Monitoring Order (DW-2022-0001-DDW) required 384 California public water systems covering 1,296 individual water sources to test for 25 PFAS compounds quarterly beginning in 2023. Source: California SWRCB PFAS monitoring page.
California's own scientists set a Public Health Goal for PFOA at 0.007 parts per trillion, compared to the federal Maximum Contaminant Level of 4.0 ppt. That is a 571-fold gap between what California toxicologists determined to be health-protective and what federal law currently enforces. Source: California OEHHA Public Health Goals for PFOA and PFOS, April 5, 2024 (oehha.ca.gov). Regulatory compliance and health-science-based safety are not identical for PFAS.
For a detailed breakdown of the regulatory gap and what it means for IE homeowners, see our Inland Empire PFAS water data article.
What water treatment do IE homeowners use?
The two most common treatment approaches in San Bernardino County address hardness and drinking water quality separately, because they require different technology.
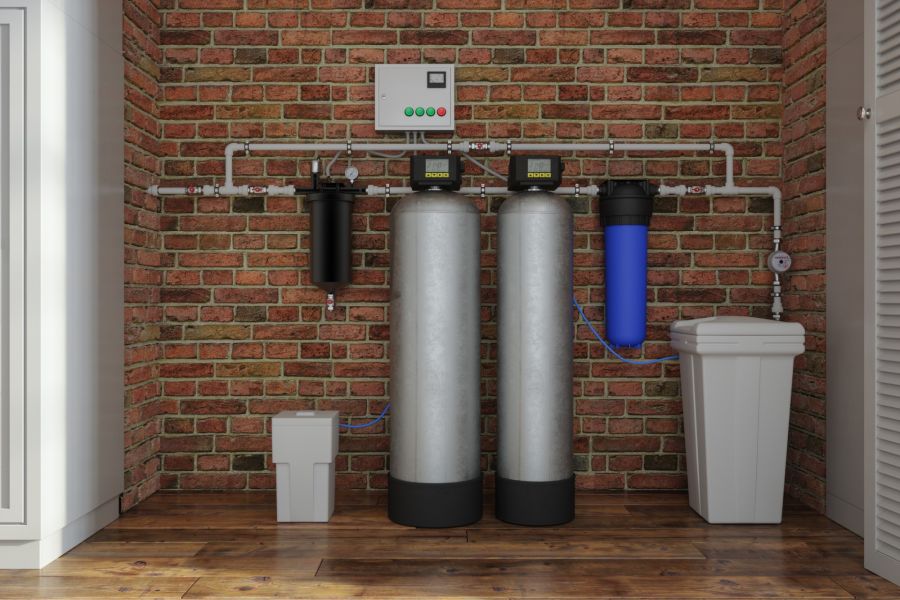
For hardness: Ion exchange water softeners are the only method that removes calcium and magnesium from the whole-house supply. The softener's resin bed swaps sodium ions for hardness minerals before water reaches any fixture or appliance. At 14 to 20 gpg, without softening, scale accumulates inside water heaters within the first year and measurably reduces thermal efficiency over time.
For drinking water quality: Reverse osmosis systems certified to NSF/ANSI Standard 58 reduce PFAS, TDS, nitrates, chromium-6, and other dissolved contaminants by 90 to 99 percent at the point-of-use tap. RO systems treat one tap, typically the kitchen faucet, rather than the whole house.
Many San Bernardino County homeowners use both: a whole-house softener for scale protection at every fixture and appliance, and an under-sink RO unit for drinking and cooking water.
Iron presents a separate treatment path. Where iron is elevated, an oxidizing iron filter using greensand or catalytic media ahead of the softener is the standard configuration. A water test that identifies both the concentration and the form of iron, dissolved versus particulate, determines the right filter specification. For a full breakdown of iron treatment in the county, see our San Bernardino County iron and manganese data article.
How to get your San Bernardino County water tested
The fastest way to get a baseline on your water is a free in-home test. We bring a calibrated meter, measure hardness, pH, TDS, and chlorine at your cold and hot taps, and leave you a printed report. This covers the parameters most relevant to equipment selection and gives you a direct reading at your specific address rather than a utility average.
For PFAS, a separate certified lab panel using EPA Method 533 or Method 537.1 is required. Standard field tests do not detect PFAS at the parts-per-trillion concentrations relevant to health risk. If your area has documented PFAS sources, a California ELAP-accredited laboratory test is the appropriate follow-up after a field screening.
Every California utility's most recent Consumer Confidence Report is publicly available through the SWRCB Electronic Annual Reporting database. Search by your utility name to access the full report, including all tested parameters and comparisons to state and federal MCLs.
Book a free water test in Rancho Cucamonga or San Bernardino County. Call (949) 873-1129 any time.